Participation in Open Exhibits – The First Thirty Days
We recently exported the information from our member database to get a better idea of who’s using Open Exhibits, thirty days in. (Click on the graphs to see them full size.) So far, we’ve discovered that:
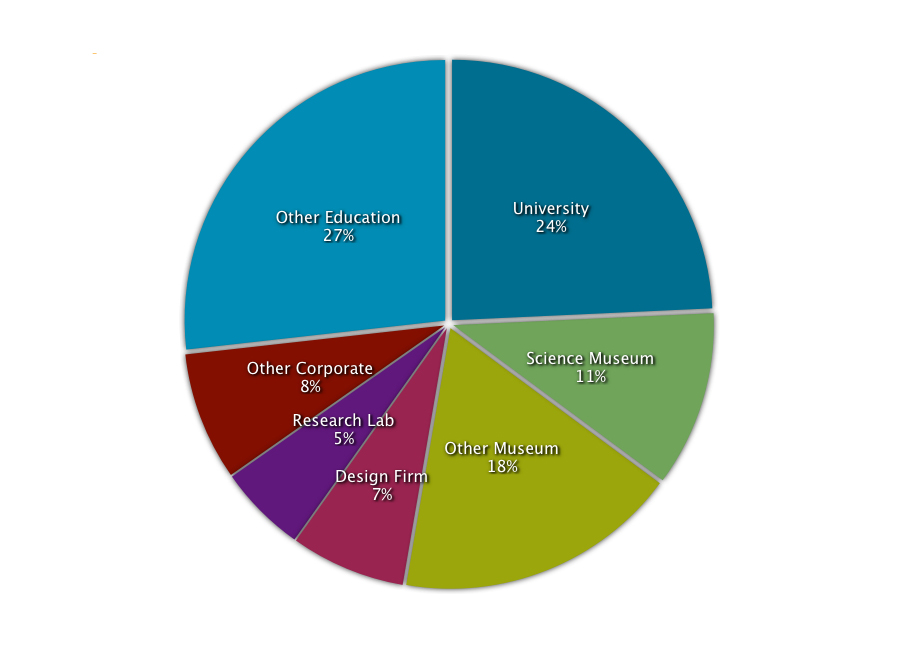
- 51% of our users have an educational or university affiliation; 29% are affiliated with museums, zoos & science centers; and the remaining 20% are involved in business or for-profit research.
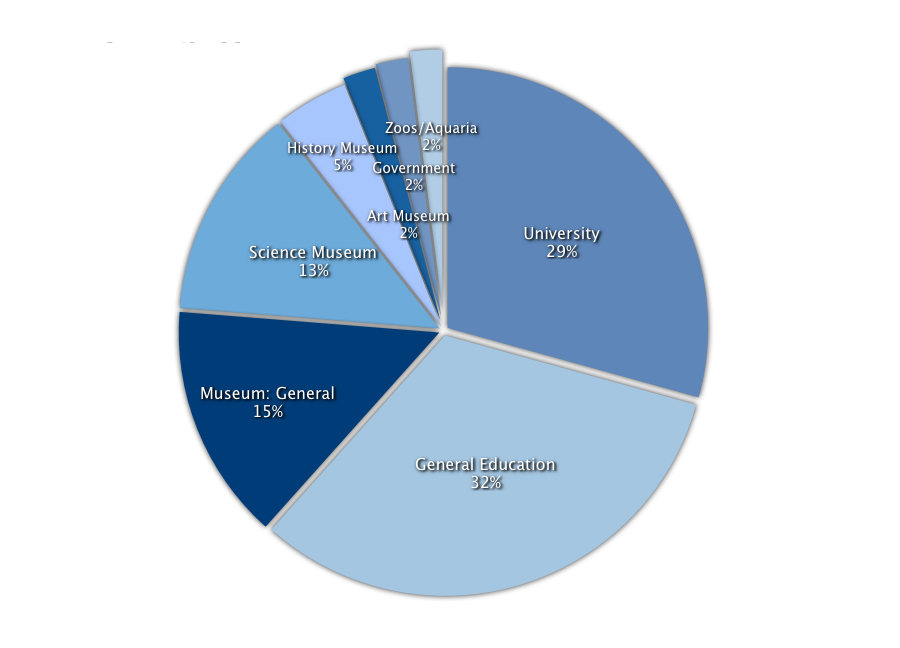
- Of our educational and museum users, 29% are from universities, 15% are from the general museum field, 13% are from science museums, 5% are from history museums, 2% are from art museums and 2% are from zoos and aquaria.
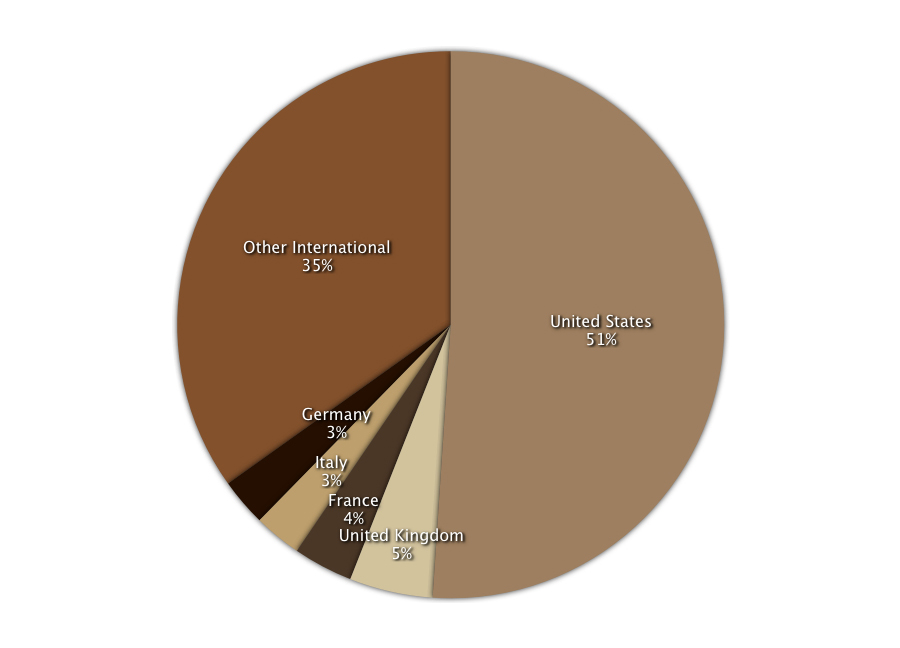
- 51% of users are from the US, with the other 49% coming from 42 other countries around the world.
- 70% of users have requested Core, which is great! If you haven’t, you can do so from your profile page or learn more about it on the software page.
We’ll be coming out with updates to these statistics and more in-depth information as the project goes on. If you’re an Open Exhibits user, keep a look out for an email with a few brief questions about your experience with the site and software. We’d really appreciate you taking the time to fill it out so that we can better understand what you hope to do with Open Exhibits and how we can help you do it.
by Erin Rose ![]() on December 16, 2010
on December 16, 2010