Blog
Multi-Touch in the K12 Classroom
Hi all,
Thanks first of all for welcoming me into this exciting project and community.
I have an idea, which is growing into a full-blown project, regarding the possibilities for the use of multi-touch tables in K12 classrooms.
Many classrooms are now equipped with interactive whiteboards. These tend to be expensive, and  more importantly the focus of learning is at the front of the room. In such an environment, learning and activity are rarely in the hands of students. What if the interactive whiteboard were laid on its side and became a platform for student-centered learning? What if the surface accepted input from many students at a time, and through their fingers and hand gestures? What if students and teachers could easily insert their own instruction and activities into the system? This new tool for raising student achievement intends to capitalize on the innovative energies of students to allow them to transform their classrooms.
As the cost of large, professionally made multi-touch tables is beyond the budgets of most k12 institutions, I've applied for funding to build a prototype (projector-based DSI) to model the technology and gain support. High school students will build the prototype, and we of course plan to use Open Exhibits software. We'd also like to develop an easy way for teachers to add activities and resources through an in-board scanner, and to model the use of multi-touch technology to facilitate mathematics and handwriting instruction from elementary school classrooms using gestures.
Sorry to be so long-winded, but I'm very interested in any feedback the OpenExhibits community may have, specifically, any advice for further funding/donations/freebies :)
Thanks so much for reading,
Jeff Mummert
Hershey High School

Visual Facilitation Images from the OE Design Summit
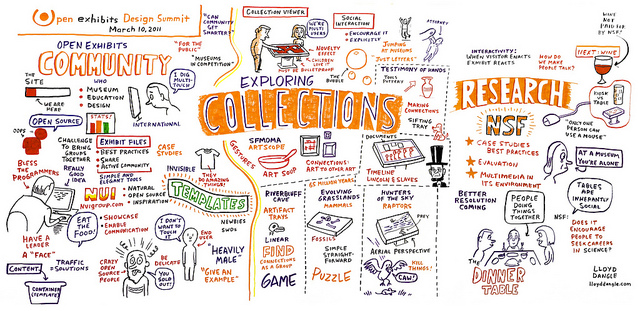
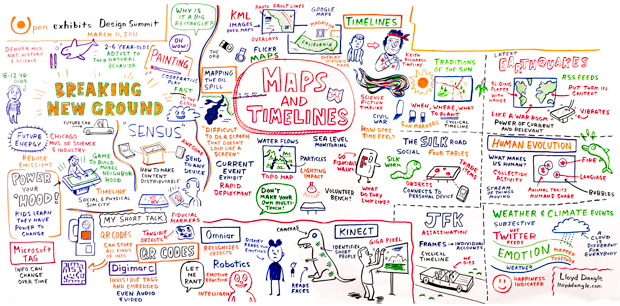
We were very fortunate to work with cartoonist and visual facilitator Lloyd Dangle during the Open Exhibits Design Summit. Lloyd drafted these incredible 4' by 8' drawings of key take-aways and ideas shared throughout each day. You've likely seen snippets of these amazing illustrations in Summit related blog posts, but here they are in complete form.
Here is the complete panel from Day 1:
Here is the panel from Day 2:
SENSUS and Open Exhibits - Easy Sharing Between Tables, Tablets & Phones
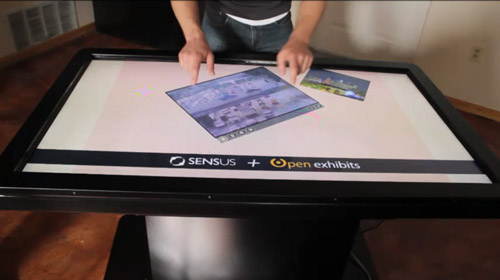
This video demonstrates the results of a recent collaboration between SENSUS and our own Open Exhibits software initiative. The concept is simple: make networking and sharing transparent across multitouch devices and operating systems. The demo video shows an Android Tablet (Samsung Galaxy), a Multitouch Table (our own, new MT55), a Windows 7 multitouch kiosk, and an iPod—all sharing media items (images, video, and a Google Map) effortlessly.
This easy sharing is made possible with Konnectus software which is a new cloud-computing platform developed by SENSUS. The Konnectus software and the Open Exhibits modules will be available later this summer.
Here's more about Konnectus and our partners at SENSUS... KonnectUs is a new cloud-computing software platform by SENSUS designed to make sophisticated networking functions easy and intuitive for users across a range of devices including multitouch tables, desktop computers, tablets, and mobile phones. KonnectUs “Natural Networking Technology (NNT)” empowers users to connect seamlessly across all major platforms – from Windows to Android to iOS. The new software aims to deliver a desktop user experience for key cloud-based services such as file sharing, social networking and location-relevant distribution of content. Additionally, KonnectUs APIs allow developers the opportunity to leverage the power of SENSUS networking technology through integration into third party applications.
You can read the full-press release on the SENSUS Website more about Konnectus, here. (Cross-posted on the Ideum Blog: Ideum blog)
Mapping and Timelines Activity Summary - Open Exhibits Design Summit 2011

In a key activity on the last day of the Open Exhibits Design Summit, participants were asked how best to create exhibits that use maps or timelines.
Exhibit themes were selected by project advisers, and were practical examples of real exhibits from museums around the world. Summit attendees spent an hour engaged in a hands-on process that resulted in a series of drawings, diagrams, and illustrations describing the newly formed exhibits.
The activity centered around the following exhibits and information: Latest Earthquakes, Traditions of the Sun: Chaco Canyon, The Silk Road, Timeline of Human Evolution, the JFK Timeline, and Weather and Climate Events.
After the session, participants shared ideas on how to optimize the presentation of interactive timelines and interactive mapping exhibits on the museum floor. Summaries of each outcome can be found below.
For a complete description of the activity, please see this PDF:
Group 1
Topic: Latest Earthquakes
The idea for this exhibit was to run a constant list of the earthquake data via RSS feeds on the side of a map, with epicenter locations appearing directly on the map. Selecting a quake event would produce a set of spinouts with data on that particular quake type. By touching the subduction and fault zones, users could explore the idea of tension and release.
Discussion turned to methods of how best to convey resistance visually. Environmental cues, like shaking the table or floor in response to the quakes were also considered.
This hypothetical exhibit communicates how the massive global scale of earthquakes and fault zones relates to an individual.

Group 2
Topic: Traditions of the Sun: Chaco Canyon
The second group focused on the culture of Chaco Canyon in New Mexico, particularly the ancient Pueblo residents' knowledge of solar and lunar cycles as tools for planting crops. Powerful images of time lapse and alignment are significant in Chaco imagery. The group sought a way to visually convey this alternative method to monitoring time.
Exhibit users learn when and where to plant through solar observation, placing fiducial markers on the table to initiate planting.
The group discussed the possibility of making the entire exhibit a Great House, similar to Pueblo Bonito.
Details were debated among the group. Where would users plant? How would they interact? Could fiducial markers be utilized effectively as part of this exhibit? It was warned that the next generation of multitouch displays may not support fiducial objects.
Group 3
Topic: The Silk Road
The Silk Road is such a large topic, Group 3 decided to hone in on the social aspects of trade, focusing on the multitouch table with iPhones and iPads as supporting technology.
They identified four important cities along the Silk Road that possessed goods like silk, spices, gems, glass, paper and pottery. There were objects the user could remove from the table and "take out" to an iPhone/iPad. There were also physical objects throughout the exhibit a user could photograph and then "place" back on the table.
Commodities could be moved along trade routes to reveal hidden information, allowing the user to learn more about the region and how it related to that object. One attendee said, "This helps a stagnant collection be more dynamic."
Other creative options were suggested, such as users beginning with an amount of credit, or perhaps starting only with items that would fit on their camel. Either of these would promote user interaction in market life. The exhibit plan would also create a comparitive experience between a rich and poor person.
There was concern from the audience over the seeming complexity of the game; others saw this as a benefit because it could be used as an educational platform.
 Group 4
Topic: What Makes Us Human?
Group 4's exhibit was structured as an evolution game that involved creation of bubbles on a screen, each containing a symbol representing a trait such as consciousness, opposable thumbs, tool usage, harnessing fire. Bubble traits were variable, capable of changing over time. Bubbles would be surrounded by images of animals, with a goal of trying to connect a group of trait bubbles with their corresponding animal.
As the bubbles connect, some animals would disappear, incapable of the coupled qualities of the joined bubbles. This could be used as a learning tool to create awareness of what makes us human and to point out the areas where humans are not unique.
In order to engage with the exhibit, the screen would need to be interactive, allowing the users to move bubbles and connect them. When unattended, the table could display a dynamic environment so bystanders could observe the relationships and results of evolution unfold before the eyes.
Group 5
Topic: The JFK Assassination Timeline
The weight of this topic made it challenging for the group to select a method for depiction of the timeline. In the end, they chose two methods and opted to present both to summit attendees. 
The first was linear and showed different times of the day, which included an audio component. Sound bytes depicted the everyday activities of people's lives. As the exhibit moved through the day the audio changed and focused more and more on JFK and the event that would end his life.
The exhibit was meant to repeat as a loop, allowing users to jump in at any point in time, or wait to begin from the start. There was also a fixed timeline that marched users through the events of the day.
Users could take a digital frame and place it over the various images on the table allowing the user to then take an object to a separate kiosk and learn more about it.
The second plan involved concentric time tables that would be navigated like sections of a tunnel. This timeline took place on what Group 5 called the Z-axis.
A number of framed images would surround the concentric time tables. The user could explore the frames as the events of the day unfolded. Framed content would reflect a moment in that day instead of using a marching timeline. All depicted events converge at the point when JFK was killed, along with the dramatic events following.
Group 6
Topic: Weather and Climate Events
This group was tasked with looking at weather and climate, demonstrating their effects on both time and geography. Weather is often experienced as a crisis. The group wanted to craft the exhibit in such a way that a user felt as if they were personally experiencing the weather. They settled on an idea similar to artist Jonathan Harris, whose work has explored the relationship of people's emotions to weather over time.
Each evening weather-related tweets would be harvested and correlated to a map, showing the intersection of "public" mood and weather. The addition of a ratings and feedback sytem into this model were also discussed. Participants predicted that limited social interaction was a potential flaw in the structure of the exhibit.

Thinking about Timelines with John Llewellyn
 In the lead up to the timeline design acitivity John Llewellyn from the Museum of Science and Industry in Chicago presented a few examples of successful timelines, exploring both linear and object-oriented timelines in museums.
According to Mr. Llewellyn, many museum timeilne exhbitis are successful, some are not, including the Civil War in Four Minutes built around Lincoln.
He went on to suggest that visual waveform representations of music such as in sound editors like garage band, can help us to understand timelines in exhibits.
"Timelines are a balance between simplicity and complex interrelationships."
There is a historical aspect and a process aspect. What is the textural feel of time? How do we show these connections and make them sing?
Slides from John Llewellyn's presentation can be viewed here: